Class of 2027 · Aspiring physician & student researcher
I look for the signal
before it becomes
the symptom.
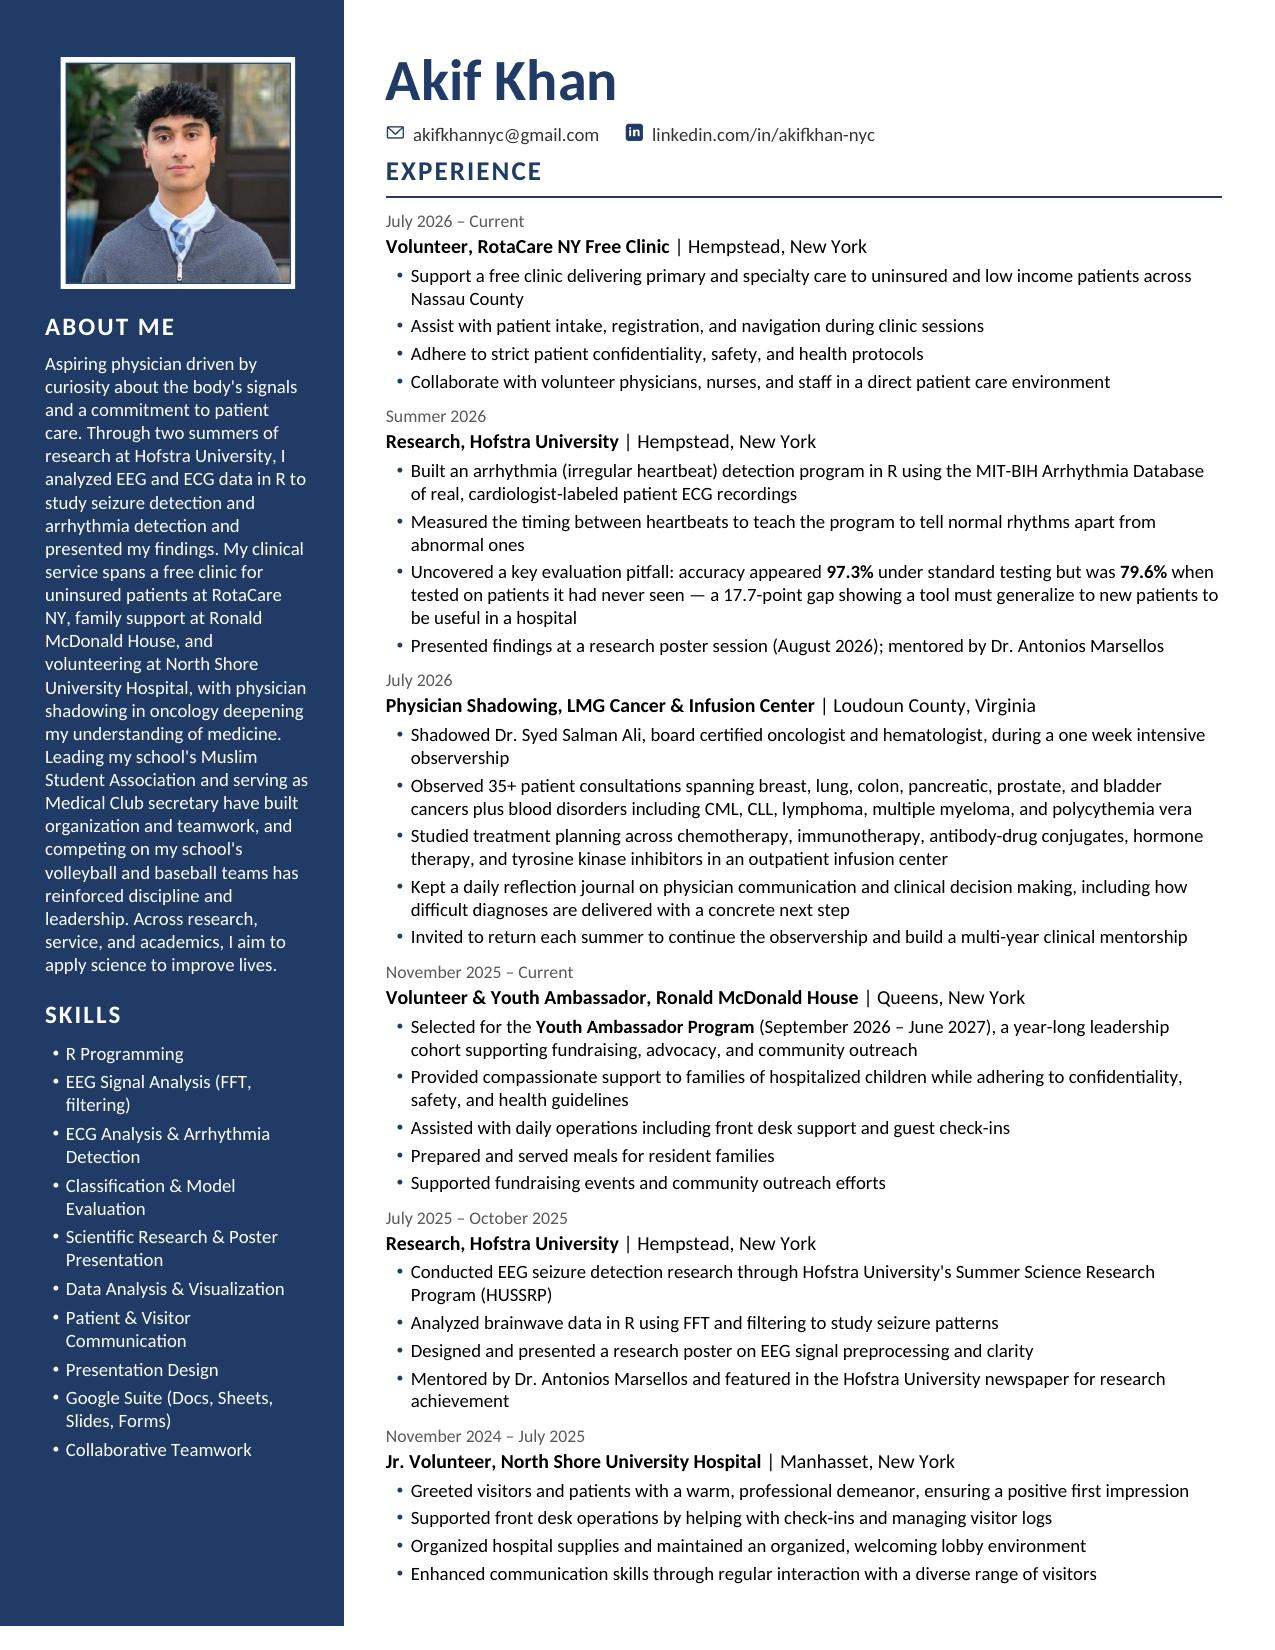
I'm curious about how small signals can reveal something much bigger, whether they come from a brainwave, a heartbeat, or a conversation with a patient. That curiosity has led me into research, clinical settings, community service, leadership, and athletics. Together, those experiences have shaped how I think about medicine as a field that requires scientific precision, empathy, humility, and the ability to listen closely to people.
- 260+
- Volunteer hours
- 35+
- Patient consultations during oncology observership
- 40
- Shadowing hours
- 5
- Days in clinic
- 3
- Research projects
- 99.5
- Weighted GPA
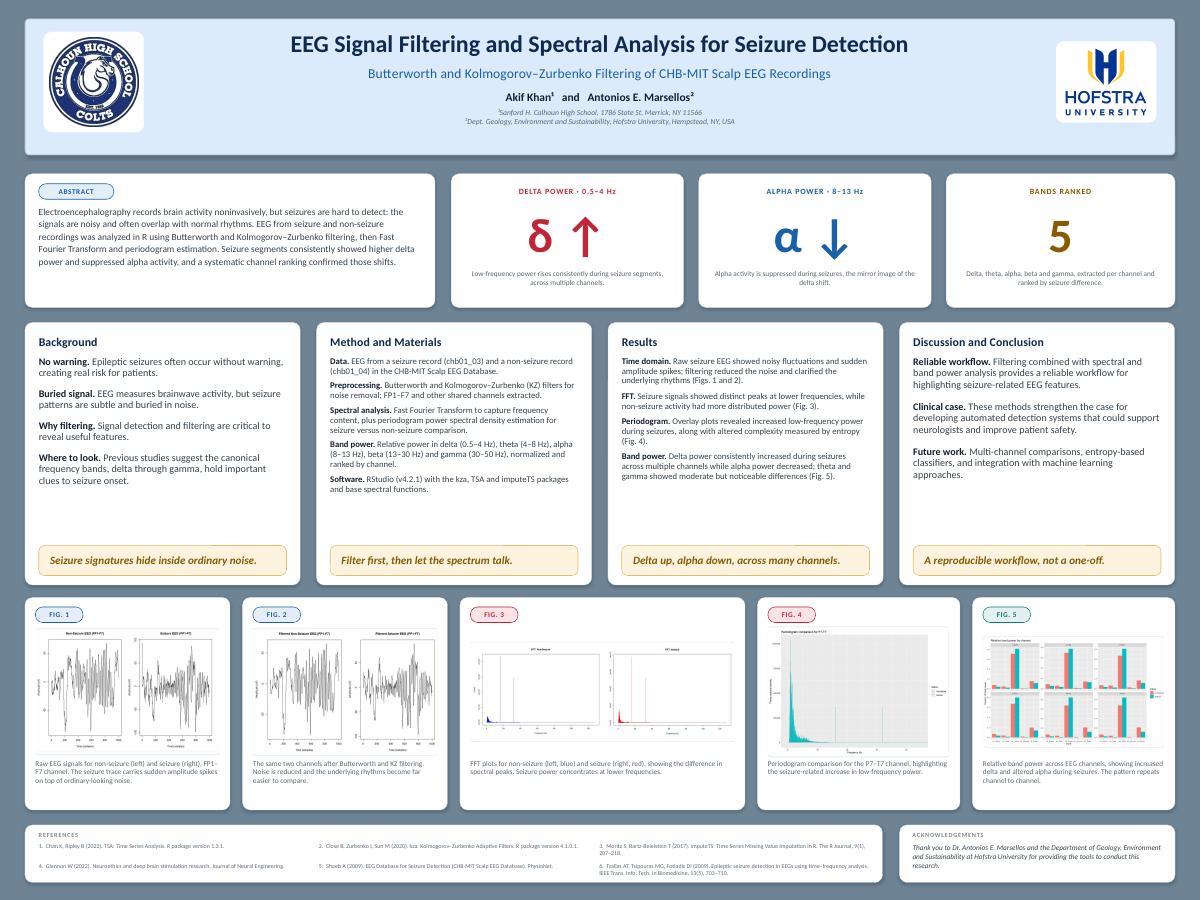
Finding Seizure Patterns in EEG Brainwaves
Seizure activity hides inside ordinary EEG noise. Working in R with the CHB-MIT Scalp EEG Database, I compared Butterworth, Kolmogorov–Zurbenko and an adaptive hybrid filter, then used FFT and periodogram estimation to ask which one reveals seizure structure without inventing it. Every figure below is rebuilt live from the poster's data.
Research question
How can EEG filtering reduce noise while preserving the brainwave patterns that distinguish seizure activity from non-seizure activity?
Research approach
Using the CHB-MIT Scalp EEG Database, I compared seizure and non-seizure EEG recordings in R. I applied three filtering methods, Butterworth, Kolmogorov–Zurbenko (KZ), and an adaptive hybrid filter, and then used FFT and periodogram analysis to examine how each method affected the frequency content of the signal. I also calculated relative power across the delta, theta, alpha, beta, and gamma frequency bands to compare seizure and non-seizure activity.
Research Leadership
Working under the mentorship of Dr. Antonios E. Marsellos, I led this research project from raw EEG recordings through analysis and final presentation. Using R, I processed CHB-MIT EEG data, implemented Butterworth, Kolmogorov–Zurbenko, and adaptive hybrid filtering methods, performed FFT and periodogram analyses, calculated frequency-band power, evaluated signal preservation, and created the figures used to present my findings.
Faculty mentor
Dr. Antonios E. Marsellos
Hofstra University
Faculty mentorship and scientific guidance throughout the Hofstra University Summer Science Research Program.
Key findings
The seizure recordings showed a clear shift in frequency-band activity. Delta power increased by 27 percentage points during seizure segments, while alpha power decreased by 11 points. The filtering methods also differed substantially in the amount of noise they removed, with KZ reaching the highest observed noise reduction at 38.1%, compared with 34.0% for the adaptive filter and 16.1% for Butterworth.
Delta power, 0.5–4 Hz
+0 pts
Relative low-frequency power rises consistently in seizure segments, channel after channel.
Alpha power, 8–13 Hz
−0 pts
Alpha is suppressed during seizures: the mirror image of the delta shift.
Peak noise reduction
0.0%
Upper bound for the KZ filter, versus 16.1% for Butterworth and 34.0% adaptive.
Time domain, FP1–F7
Spectral density, 0.5–50 Hz
Relative band power, seizure vs non-seizure
Absolute band power, log scale
Dominant band across recordings
Elevated during seizure segments
Moderate presence
Reduced after filtering
Mostly suppressed after filtering
Delta dominates every recording by an order of magnitude. Gamma is almost entirely suppressed once filtering is applied, which is exactly the trade-off the AP Research paper set out to quantify.
Conclusion
This research showed me that identifying seizure-related EEG patterns requires more than simply removing as much noise as possible. Seizure activity consistently shifted power toward the lower-frequency delta band while reducing alpha activity, making spectral and band-power analysis especially useful for distinguishing changes in the signal. Filtering helped make those patterns easier to examine, but preserving the underlying EEG structure remained just as important as reducing noise.
Reliable workflow
Filtering combined with spectral and band-power analysis reliably surfaces seizure-related EEG features.
Clinical case
Strengthens the argument for automated detection systems that support neurologists and improve patient safety.
Not a one-off
A reproducible pipeline in R rather than a single hand-tuned result, so anyone can rerun it.
Next
Multi-channel comparisons, entropy-based classifiers, and integration with machine learning.
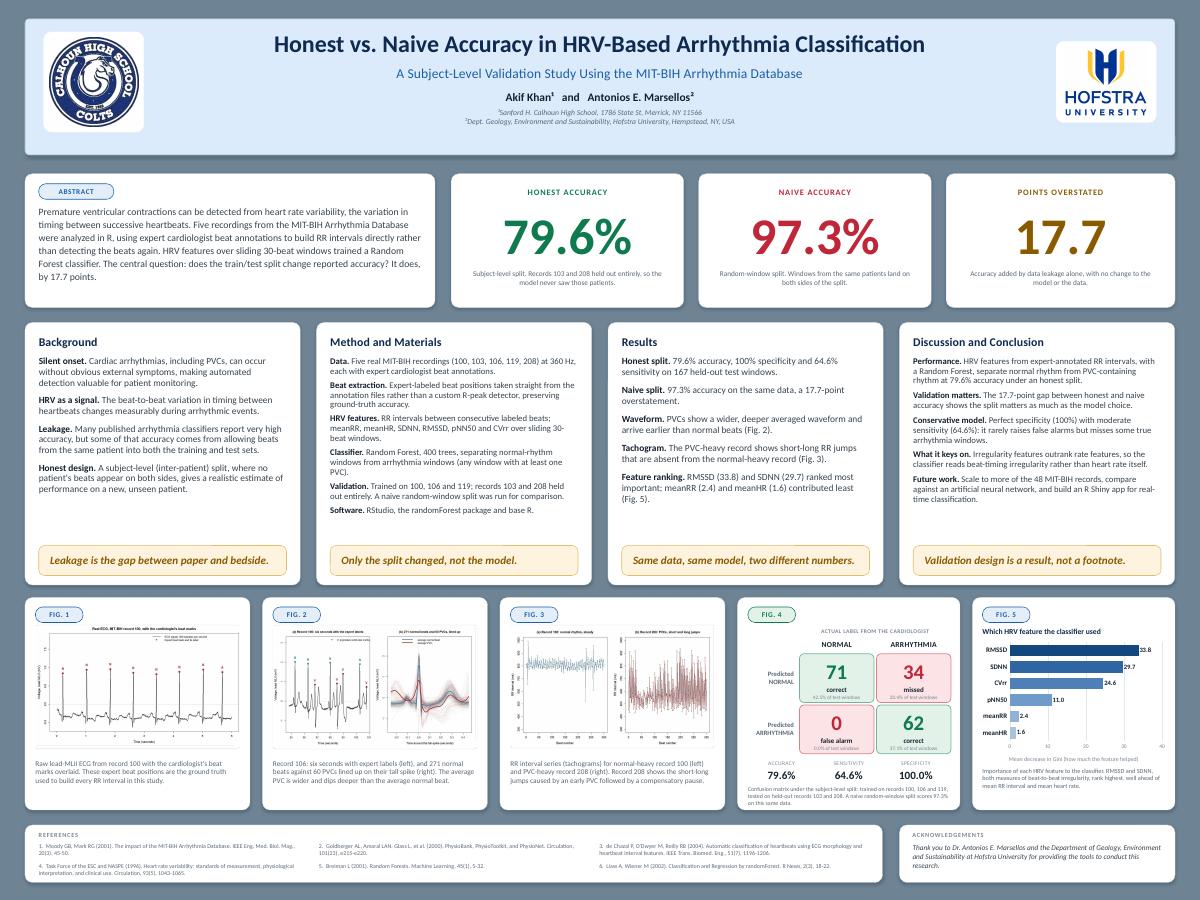
Detecting Arrhythmias Using Heart Rate Variability
Five cardiologist-annotated recordings from the MIT-BIH Arrhythmia Database, RR intervals built straight from expert beat labels, six HRV features over sliding 30-beat windows, and a 400-tree Random Forest. Then the part most papers skip: holding two patients out entirely and reporting what happens.
Research question
Can heart-rate-variability features distinguish arrhythmia from normal rhythm, and will a model that performs well still maintain that performance when tested on patients it has never seen before?
Research approach
I used five cardiologist-annotated recordings from the MIT-BIH Arrhythmia Database and converted the expert beat annotations into RR-interval sequences. From sliding 30-beat windows, I engineered six heart-rate-variability features: RMSSD, SDNN, CVrr, pNN50, mean RR interval, and mean heart rate. I then trained a 400-tree Random Forest classifier and evaluated it in two different ways: a random-window split and a stricter patient-level split in which two patient records were held out entirely from training.
Research Leadership
For this project, I wanted to understand not only whether an arrhythmia classifier could perform well, but whether that performance would hold up on patients it had never seen before. With guidance from Dr. Antonios E. Marsellos, I transformed MIT-BIH ECG annotations into RR-interval series, engineered six heart-rate-variability features across sliding 30-beat windows, implemented a 400-tree Random Forest classifier, and designed the validation strategy.
I then compared patient-level testing with random-window validation and found a substantial difference in performance. That comparison became one of the most important parts of the project because it demonstrated how strongly validation design can influence reported model accuracy.
Faculty mentor
Dr. Antonios E. Marsellos
Hofstra University
Faculty mentorship and scientific guidance throughout the Hofstra University Summer Science Research Program.
Key findings
The validation method changed the result dramatically. Random-window validation produced 97.3% accuracy, while testing on patients held entirely out of training produced 79.6% accuracy, a 17.7-point difference using the same model and features. On the patient-level test set, the classifier achieved 100% specificity and 64.6% sensitivity. Feature-importance analysis also showed that measures of beat-to-beat irregularity, especially RMSSD, SDNN, CVrr, and pNN50, contributed far more to the model than mean heart rate or mean RR interval.
The central question
Does the train/test split change reported accuracy? It does, by 17.7 points.
Subject-level split
Records 103 and 208 held out entirely
Random-window split
Windows from the same patients on both sides
Points of accuracy added by data leakage alone, with the same data, same 400-tree Random Forest, same features. Only the split changed.
Confusion matrix, subject-level split
normal
71
True normal
34
Missed arrhythmia
arrhythmia
0
False alarm
62
Caught arrhythmia
Accuracy
79.6%
Specificity
100%
Sensitivity
64.6%
Averaged beat morphology, record 106
RR tachograms
Random Forest feature importance
Conclusion
The most important result was not the higher accuracy. It was understanding why that number was higher. When windows from the same patients appeared in both training and testing, the model reached 97.3% accuracy. When I tested it on patients it had never seen before, performance fell to 79.6%. This showed me that how a model is validated can matter as much as the model itself. Patient-level testing provided a more realistic measure of generalization and exposed limitations that the random-window split had hidden.
Validation design is a result
A 17.7-point gap between honest and naive accuracy means the split matters as much as the model.
Conservative by nature
100% specificity with 64.6% sensitivity: it rarely cries wolf, but it misses some true arrhythmia windows.
Ground truth, not re-detection
Beat positions came from cardiologist annotations rather than a custom R-peak detector.
Next
Scale to more of the 48 MIT-BIH records, benchmark against a neural network, and ship an R Shiny app for real-time classification.
How EEG Filtering Can Alter Seizure Signals
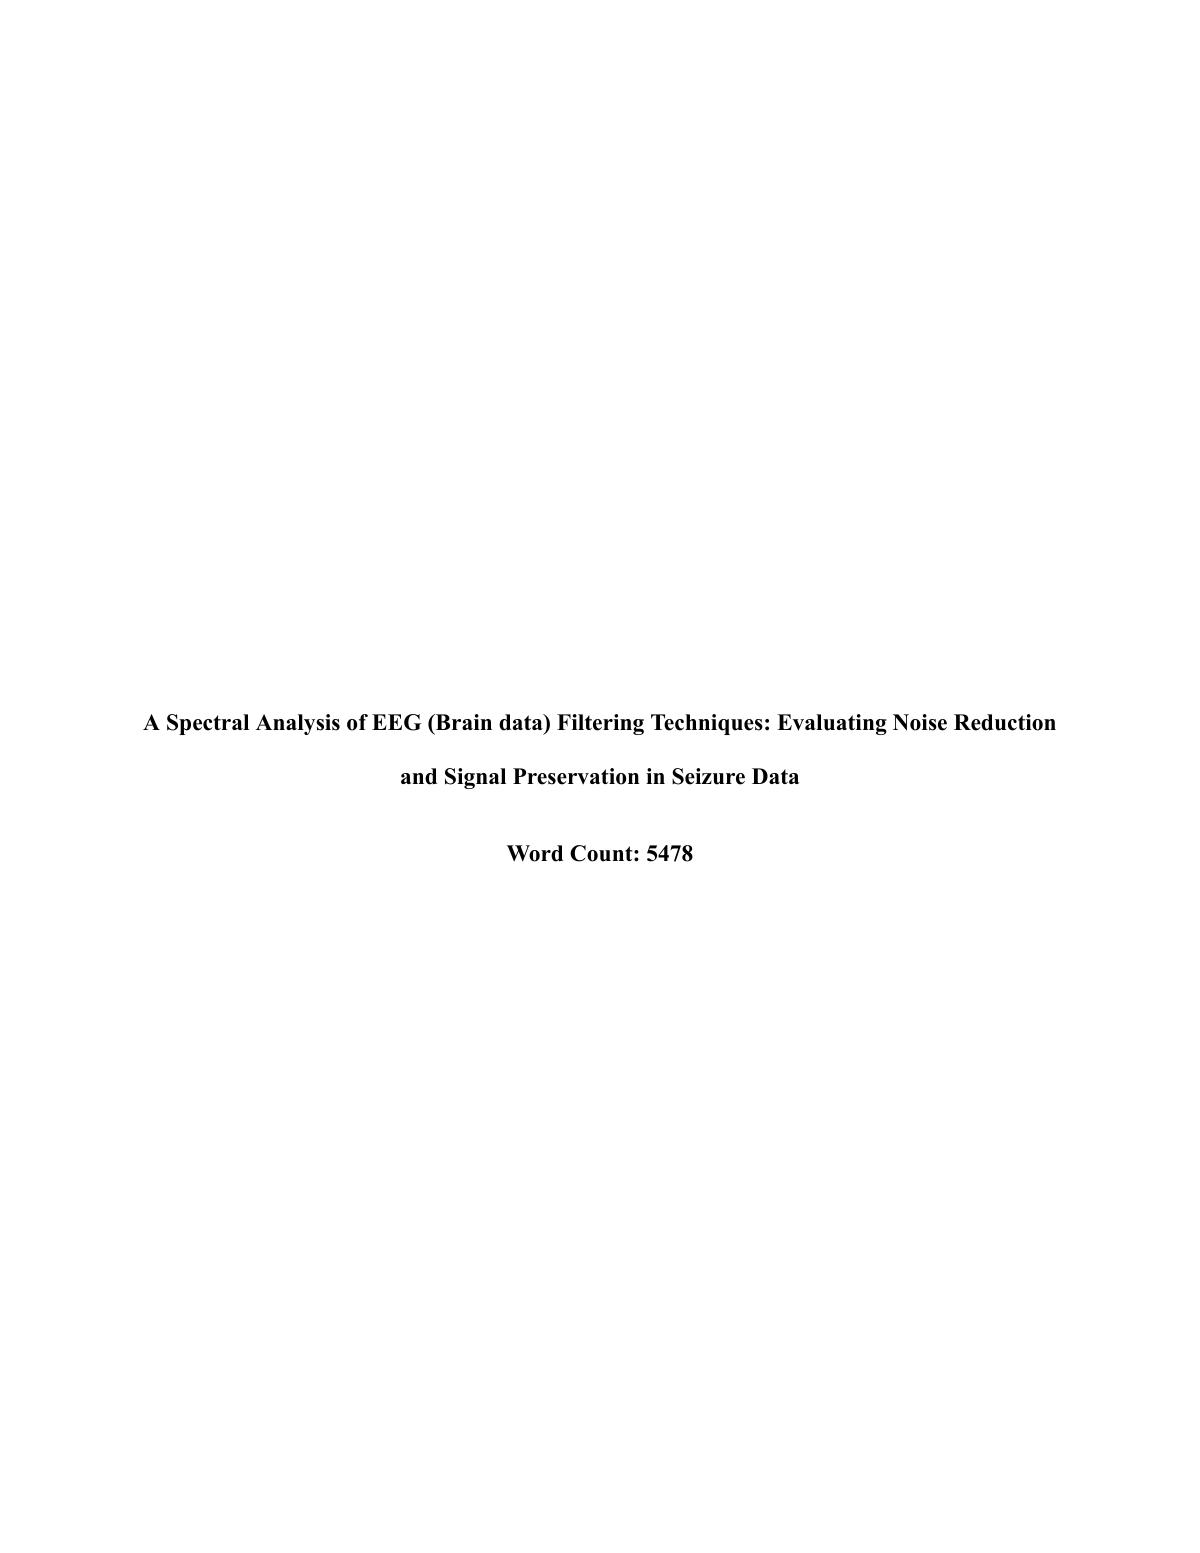
My AP Research paper isolated preprocessing as the only variable and compared Butterworth, KZ and an adaptive hybrid across CHB01–CHB05. The finding that mattered most was uncomfortable: noise reduction percentage is a misleading standalone metric, because a filter can score well while erasing the very spectral peaks that make a seizure identifiable.
Research question
How do Butterworth, Kolmogorov–Zurbenko, and adaptive hybrid filtering methods affect spectral integrity and waveform preservation in seizure and non-seizure EEG, and which approach best balances noise reduction with preservation of meaningful signal features?
Research approach
For my AP Research study, I analyzed EEG recordings from CHB01 through CHB05 and kept the underlying data and analysis framework consistent while changing the preprocessing method. I compared Butterworth, KZ, and adaptive hybrid filtering by measuring noise reduction, signal variability, waveform preservation, and changes in frequency-domain structure. I then examined where each method performed well, where information was lost, and why the adaptive approach behaved differently during high-variance seizure segments.
Independent Research
Building on questions that emerged from my earlier EEG research, I designed an independent AP Research study examining how different filtering methods affect the preservation of clinically meaningful EEG signals.
I analyzed CHB01–CHB05 recordings, implemented and compared three filtering approaches, evaluated spectral integrity and waveform preservation, and investigated why the adaptive filtering method performed poorly during high-variance seizure activity.
The project culminated in a 5,478-word single-author research paper with six appendices documenting my methodology, analysis, findings, and limitations.
Context
I completed this project independently for AP Research, extending questions I had previously explored through Hofstra University's Summer Science Research Program.
Key findings
The filters revealed a clear trade-off between noise reduction and signal preservation. KZ produced the greatest observed noise reduction, ranging from 12.6% to 38.1%, but also reduced high-frequency detail and flattened some peak amplitudes. Butterworth removed less noise, ranging from 6.5% to 16.1%, but preserved more of the original waveform structure. The adaptive method fell between the two, with noise reduction ranging from 9.2% to 34.0%, but it did not eliminate the trade-off.
One of the most important findings appeared in CHB02 seizure segments. Because variance remained elevated throughout the seizure window, the adaptive filter’s variance-based switching mechanism stayed in Butterworth-dominant mode and KZ smoothing largely dropped out. In that setting, high variance was part of the seizure signal itself, making time-domain variance alone a poor way to distinguish meaningful activity from noise.
Filter performance ranges, CHB01–CHB05
Where the adaptive filter broke
In CHB02 seizure segments, variance stayed elevated across the whole window, so the variance-based switch locked into Butterworth-dominant mode and KZ smoothing dropped out entirely. When the pathology is itself high-variance, amplitude statistics cannot separate signal from noise. Future adaptive frameworks need frequency-domain criteria, such as spectral entropy or band-specific power ratios, rather than time-domain variance alone.
High variability and noise present
Preserves structure, maintains fluctuations
Moderate smoothing, reduced high-frequency detail
Balanced noise reduction and preservation
Conclusion
My results showed that noise-reduction percentage alone is not enough to judge the quality of an EEG filter. A method can remove more noise while also flattening spectral peaks or waveform features that are part of the signal being studied. The better question is not simply which filter removes the most noise, but which one preserves the information needed for interpretation. The adaptive filter’s behavior during high-variance seizure activity also showed that future adaptive approaches should consider frequency-domain information, rather than relying on signal variance alone.
Research taught me how much information can be hidden inside a biological signal. Clinical experiences showed me that data is only one part of medicine. At RotaCare, Ronald McDonald House, North Shore University Hospital, and during oncology shadowing, I saw how much patients depend not only on sound clinical decisions, but also on clear communication, trust, consistency, and the feeling that someone is truly listening to them. I want to become a physician who can understand the evidence behind a medical decision while never losing sight of the person behind the diagnosis.
Guidance that shaped how I approach both research and medicine.
Research Mentor
Antonios E. Marsellos, Ph.D.
Associate Professor, Hofstra University
Research Mentor, Hofstra Summer Science Research Program
Dr. Marsellos mentored my EEG and HRV research through Hofstra University’s Summer Science Research Program, providing scientific guidance, feedback, and direction as I carried out each project.
Clinical Mentor · Oncology
Syed Salman Ali, MD
Board-Certified Hematologist & Medical Oncologist
LMG Cancer & Infusion Center
Shadowing Dr. Ali showed me how careful observation, clear communication, and empathy come together in patient care. Watching how he listened to patients and families shaped the way I think about the kind of physician I hope to become.
Where the data stops and the person starts
A week of oncology and hematology observership with Dr. Syed Salman Ali at the LMG Cancer & Infusion Center, plus a free clinic, a children's hospital house, and a hospital lobby.
0+
Patient consultations during oncology observership
0
Shadowing hours
0
Days in clinic
Clinical Reflections: These reflections focus on lessons from my observership. Patient-specific details have been generalized or omitted to protect privacy.
The moment that stayed with me
During a routine follow-up, Dr. Ali spent several minutes talking with a patient about life outside the clinic before discussing test results. I watched the tension in the room ease.
What it taught me
Making a patient feel heard can change the entire tone of a medical visit.
End-of-week synthesis · the story I would tell
What stayed with me was how Dr. Ali followed the difficult news with a clear plan for what would happen next, giving the patient direction in an overwhelming moment.
Oncology reminded me of my EEG research in one important way: both depend on recognizing subtle signals early, whether it is a change in a brainwave or a shift in blood counts, before the larger problem becomes obvious.
0
Volunteer placements
July 2026 – Current
RotaCare NY Free Clinic
Volunteer · Hempstead, NY
20 hours
- Free primary and specialty care for uninsured and low-income patients across Nassau County
- Patient intake, registration and navigation during clinic sessions
- Working alongside volunteer physicians, nurses and staff in direct patient care
November 2025 – Current
Ronald McDonald House
Volunteer & Youth Ambassador · Queens, NY
80 hours
- Selected for the 2026–27 Youth Ambassador Program, a year-long leadership cohort
- Support for families of hospitalized children, front desk and guest check-ins
- Prepared and served meals, supported fundraising and outreach
November 2024 – July 2025
North Shore University Hospital
Jr. Volunteer · Manhasset, NY
100 hours
- Greeted patients and visitors, supported front desk check-ins and visitor logs
- Maintained an organized, welcoming lobby environment
July 2023 – August 2023
National Inventors Hall of Fame
CAMP Invention Student Counselor · Merrick, NY
60 hours
- Taught students from kindergarten through sixth grade the fundamentals of wiring circuits
- Assisted in building robots during interactive STEM workshops, promoting hands-on learning and problem solving
- Strengthened self-awareness and leadership skills through feedback from adult mentors
Outside the Classroom, Still Learning
Two school teams and a travel season, a student association I co-founded and now lead, and a habit of showing up for things that are not on a transcript.
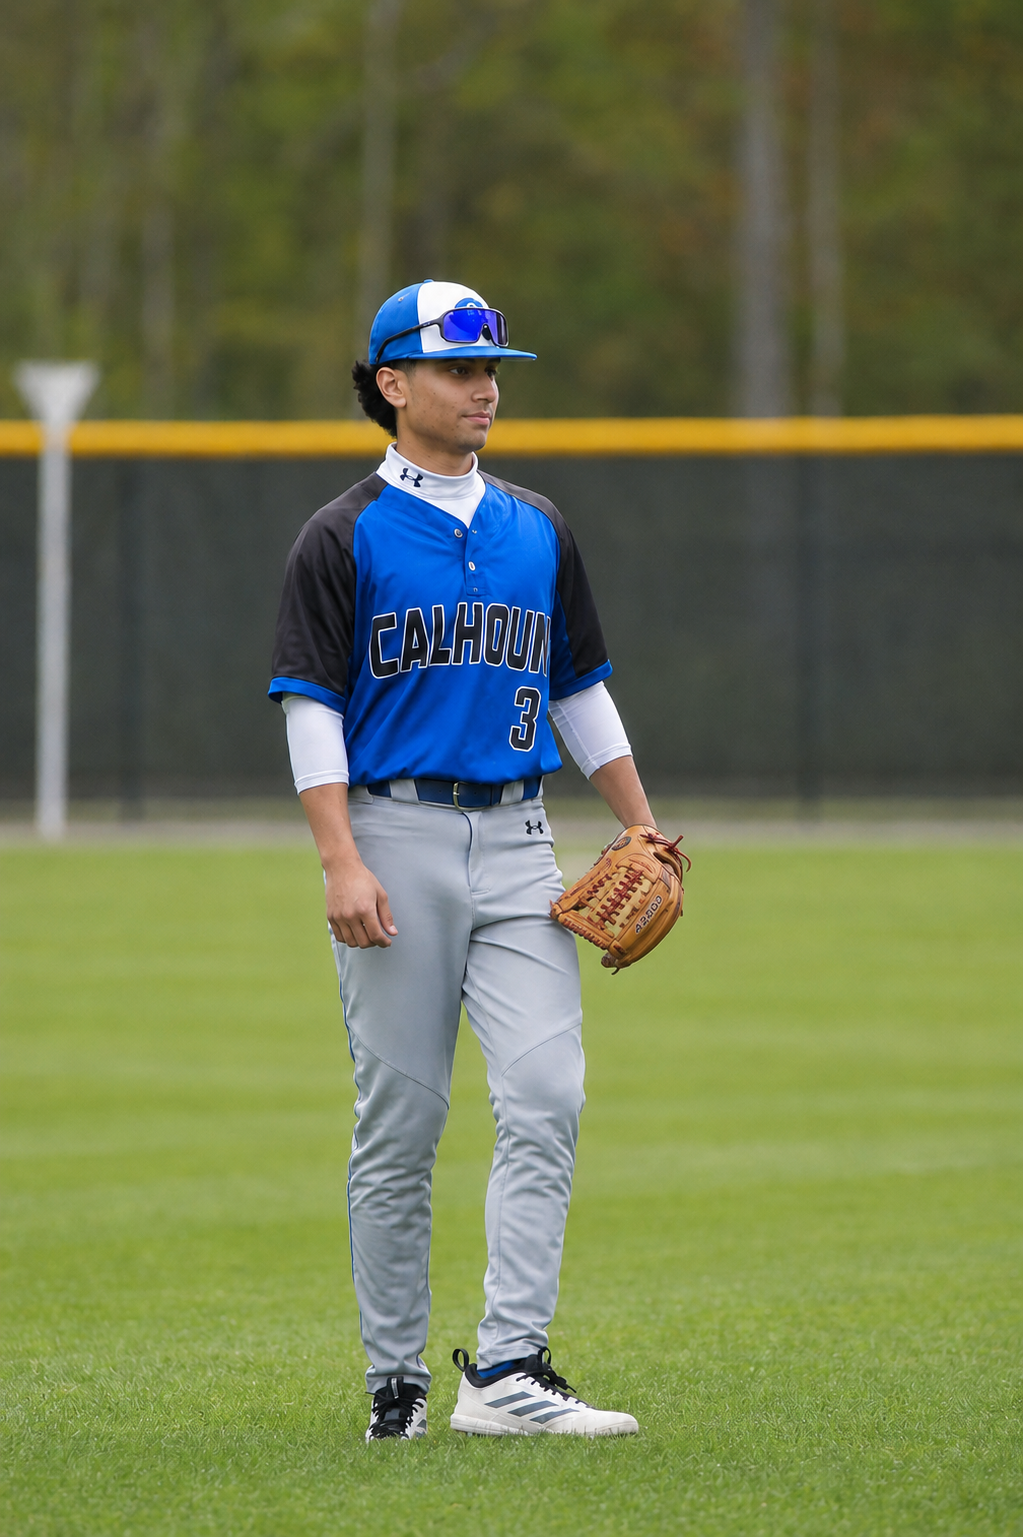
Baseball
Sanford H. Calhoun High School
A sport of small margins where preparation shows up only in the moments that count.
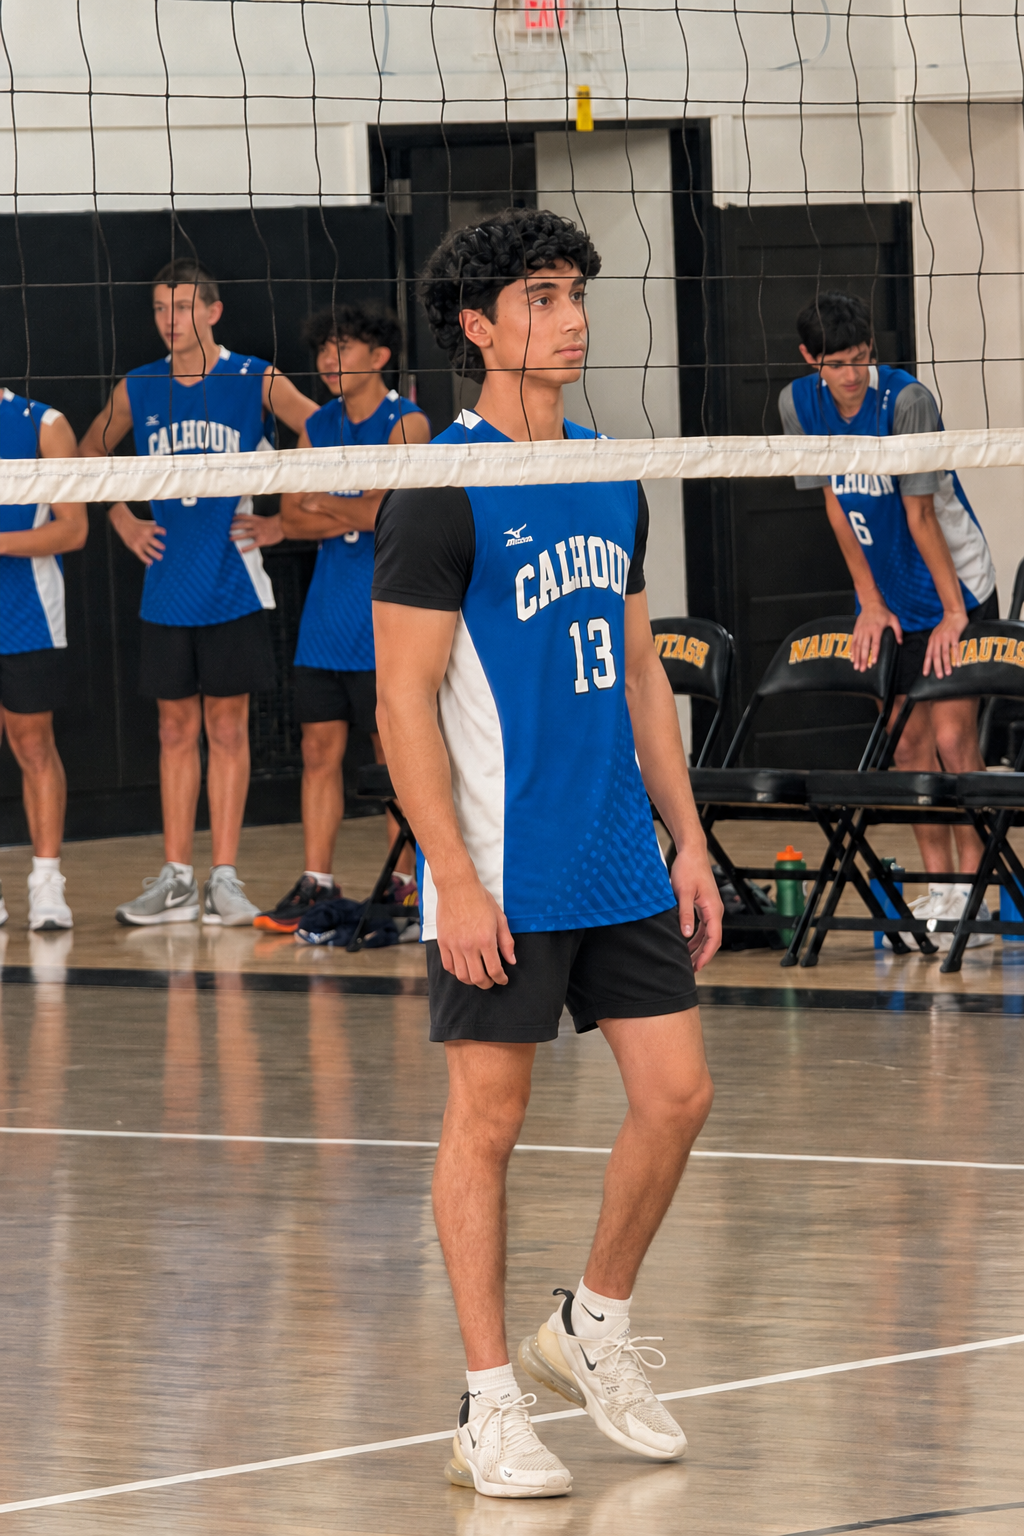
Volleyball
Sanford H. Calhoun High School
Reading the play a beat before it happens, the same pattern recognition the research rewards.
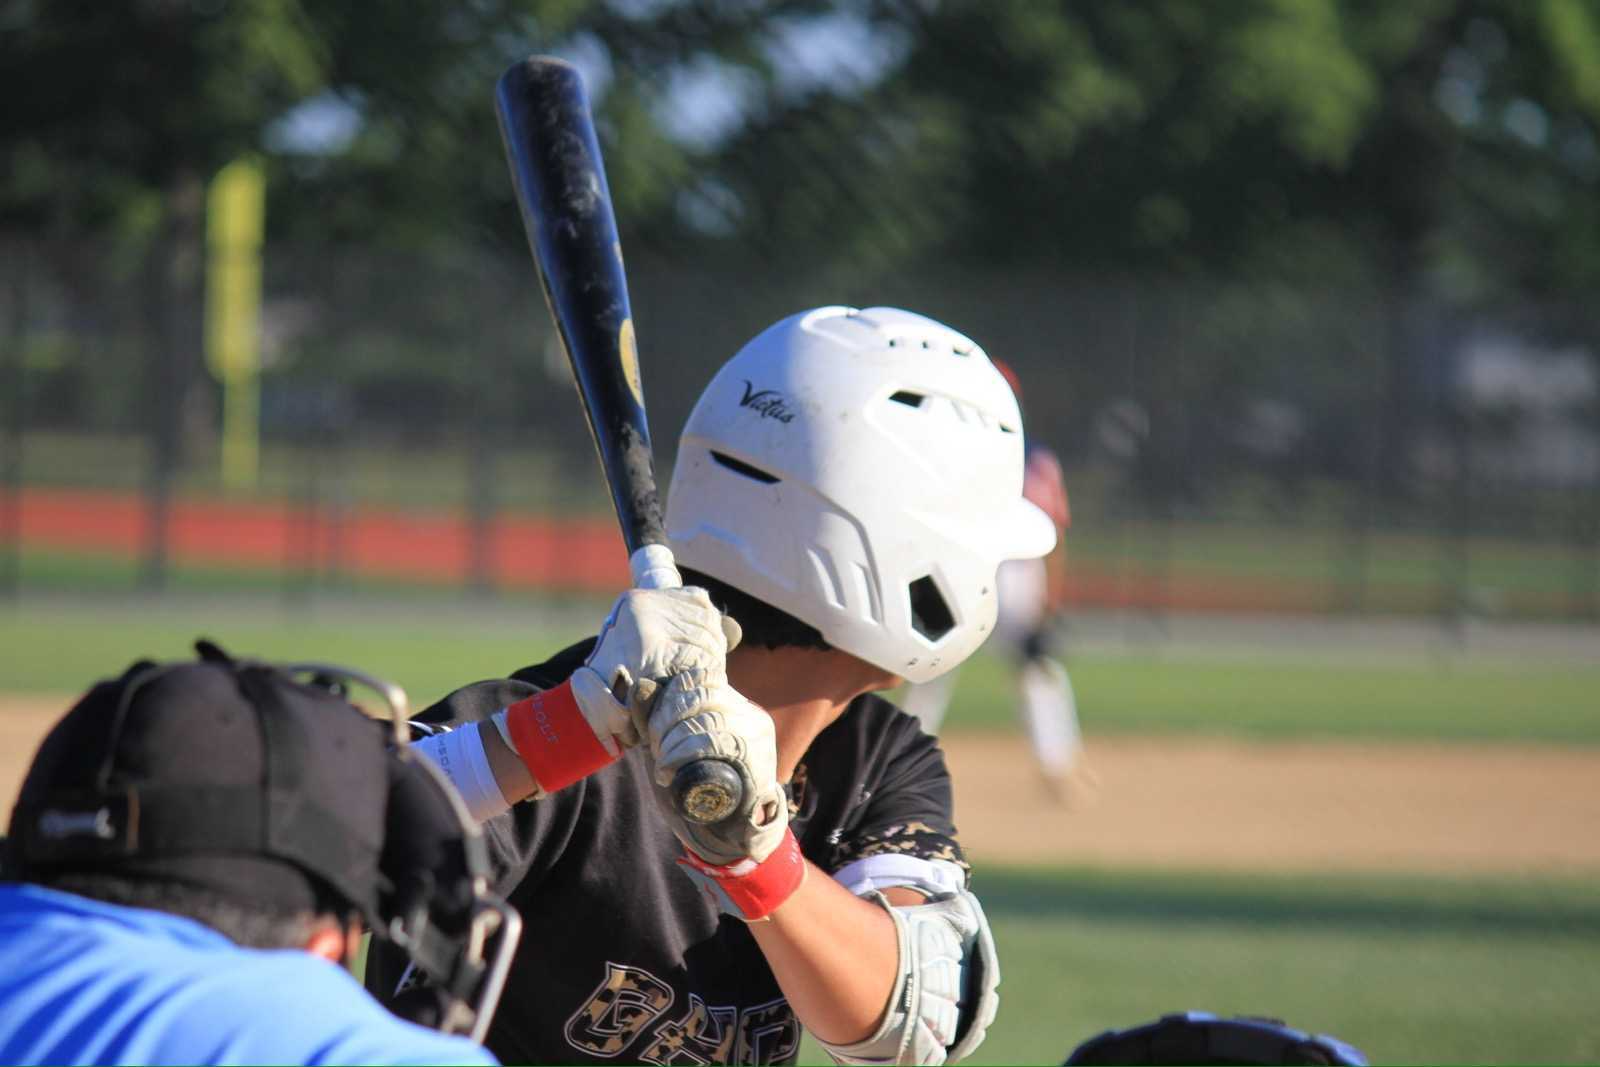
Travel Baseball
Ghost Travel Baseball
Year-round competition: long seasons, early mornings, and the discipline they demand.
Muslim Student Association
President & Co-Founder
- Co-founded the chapter, led as Vice President then President
- Organized "Chai and Chat" on navigating life in America as a Muslim student
- Coordinated a food drive raising over $400 in donations
Medical Club
Secretary
- Manage meeting records, communications and event coordination
- Bake sale fundraisers for cancer research, roughly $300 raised
Project FurGood
Volunteer
- Helped organize a bake sale raising roughly $500
- Helped build the non-profit's website to increase outreach
AP exam scores
99.5 weighted GPA
- AP Seminar5
- AP English Language5
- AP World History5
- AP Biology4
- AP Physics 14
- AP US History4
AP Research score pending. Coursework also includes AP Biology, AP Physics 1, Chemistry Honors, Algebra 2 Honors and Foundations of Engineering.
Everything, and what came of it
A running log of the labs, clinics, and classrooms, newest first, with the source documents behind each one.
June 2027
Expected graduation, Sanford H. Calhoun HS
On track to finish with a 99.5 weighted GPA while carrying a full AP load alongside research and clinic work.
June 2026 – August 2026
HRV arrhythmia poster presented at Hofstra
Showed that patient-wise validation drops accuracy 17.7 points versus a naive split, making the case against leakage-inflated results.
July 2026 – Current
RotaCare NY free clinic volunteer
Ran intake and navigation for uninsured Nassau County patients, shortening the path from door to physician each session.
July 2026
Oncology observership, LMG Cancer & Infusion Center
40 hours over five days with Dr. Syed Ali, observing 35+ consults and translating each into written reflections on how bad news is delivered.
September 2025 – May 2026
AP Research paper on EEG filtering, 5,478 words
Quantified the trade-off between noise suppression and signal distortion, documenting where adaptive filters fail on seizure onset.
November 2025 – Current
Ronald McDonald House volunteer
Served families of hospitalized children as a Youth Ambassador, running meals and activities that gave parents hours back at bedside.
October 2025
EEG poster presented; featured in the Hofstra newspaper
Work reached beyond the symposium. The university newspaper covered the findings on delta/alpha power shifts.
June 2025 – August 2025
EEG seizure research at Hofstra (HUSSRP)
Built a full filtering and spectral pipeline from raw EEG, turning a summer program into a reproducible seizure-detection study.
November 2024 – July 2025
Jr. Volunteer, North Shore University Hospital
First hospital floor experience: patient transport, supply runs and wayfinding across busy inpatient units.
July 2023 – August 2023
Camp Invention student counselor
Led elementary STEM build teams, the first taste of teaching a method rather than just an answer.
Toolkit
Source documents
Every figure on this site was rebuilt from these. The originals are here unmodified.